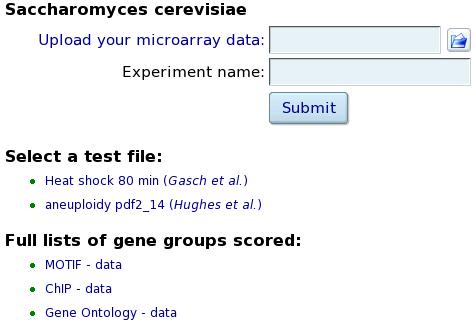
Data upload and category information: Tab delimited text files can be uploaded.
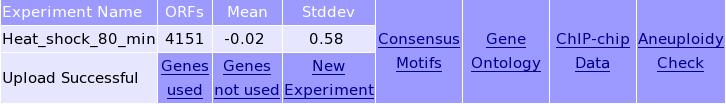
Information about the uploaded data: The left panels give general information about the transcription data. Click on the right panels to perform an analysis. Below an example is given of the T-Profiler analysis using the gene groups defined by shared motifs (the MOTIFs panel).
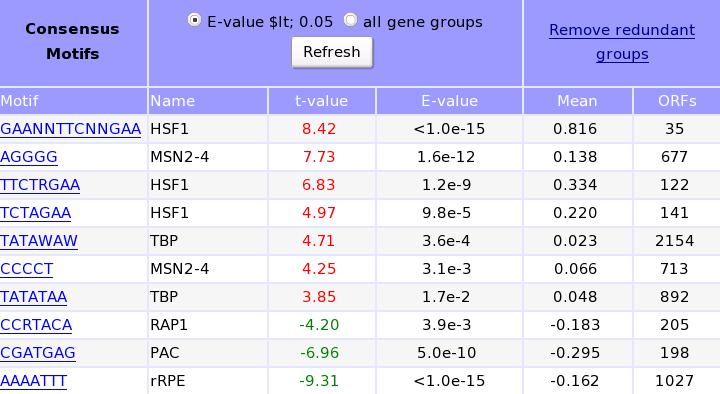
T-Profiler results using MOTIFs categories: T-test results of the motifs groups are given. Only the significant results (p < 0.05) are given: positive significant T-values are in red the negative values are in green. By choosing the all button in the upper row, all data can be obtained. The motifs can be selected to obtain information about expression values of the individual genes as shown here.
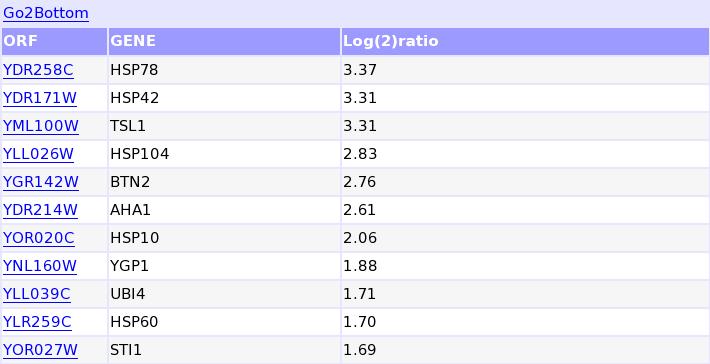
Expression values of genes sharing the GAANNTTCNNGAA motif: The ORF names are linked to the SGD data base.
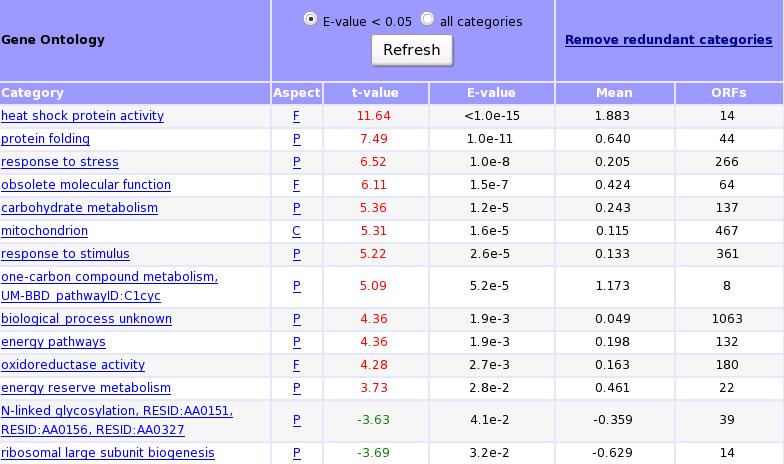
T-Profiler results using Gene Ontology categories: By selecting the GO category, gene expression information of the genes belonging to this category can be obtained. To remain only categories which are not overlapping, the iteration function can be used. This function takes the category with the highest abs(t-value) and substrates the average value of this group from the expression values of all individual members of this group. Then the calculation starts again until their are no categories with a p-value < 0.05. The iteration procedure is time-consuming: it can take up to several minutes to perform the analysis.
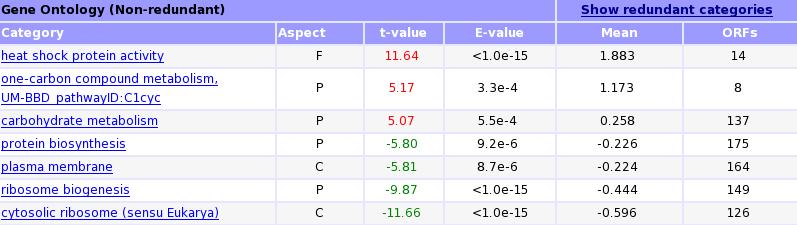
T-Profiler GO results after iteration: After the iteration procedure, only eight distinct GO categories remain.
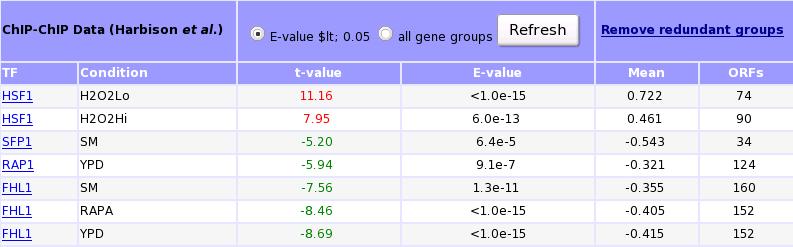
T-Profiler TFB-data results: The left columns (TF and condition) shows the transcription factor and under which category the data is obtained (Harbison et al). To obtain only the distinct categories, the iteration procedure can be used.
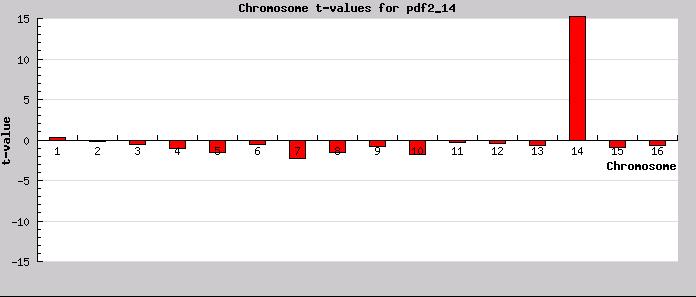
Aneuploidy detection: T-Profiler can also be used to screen for aneuploidy. An typical result is shown here, (the deletion mutant for pdf2 (Hughes et al)). From testing several aneuploid mutants, an abs(t-value) > 10 gives a good indication for aneuploidy.